Atlassian apps/Jira
Dashboard Statistics
Team, Organization & Sums for Jira
Dashboard gadgets that count work items or sum story points by Team, Organizations, Sprint or any field.
In reviewIn Atlassian’s review, not yet on the Marketplace

What it does
What Dashboard Statistics does
Two dashboard gadgets for what the built-in ones cannot do: statistics by Team, Organizations, Sprint or any field, in one or two dimensions, counting work items or summing story points and time. Charts, heat map; every number opens its work items.
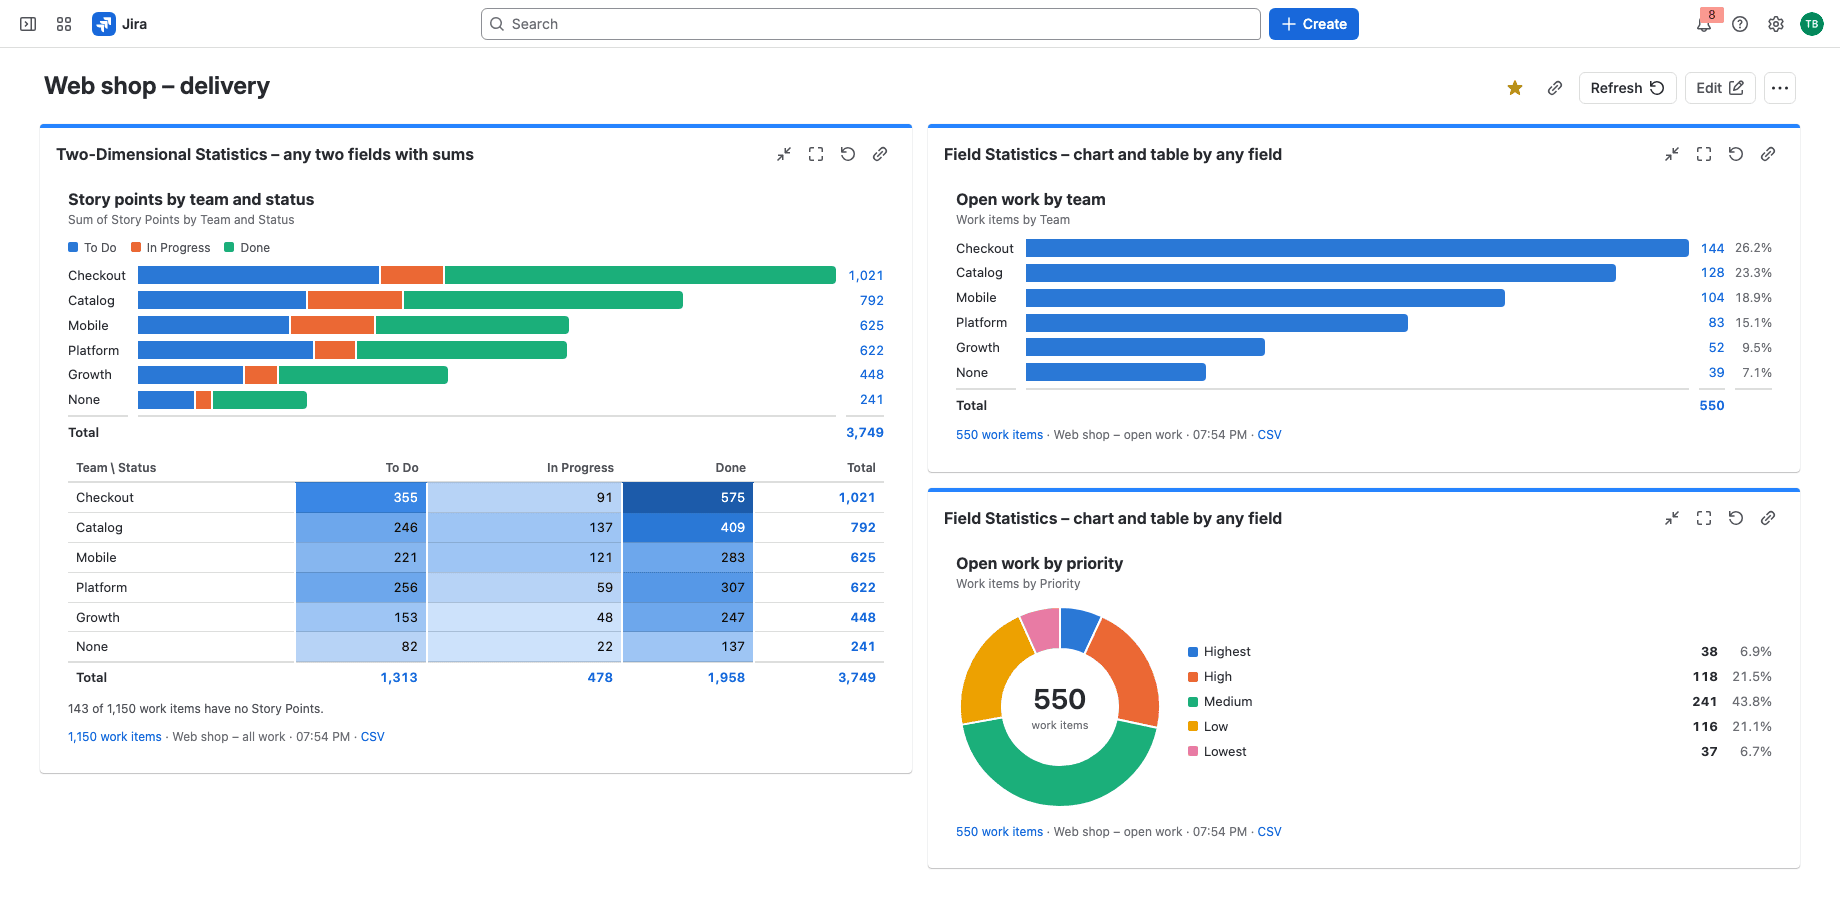
Team, Sprint and sums of story points
Group by the Team field, sprints or any other field – in one or two dimensions. Count work items or sum, average, minimum and maximum of story points, numbers and time, with totals and a heat map.
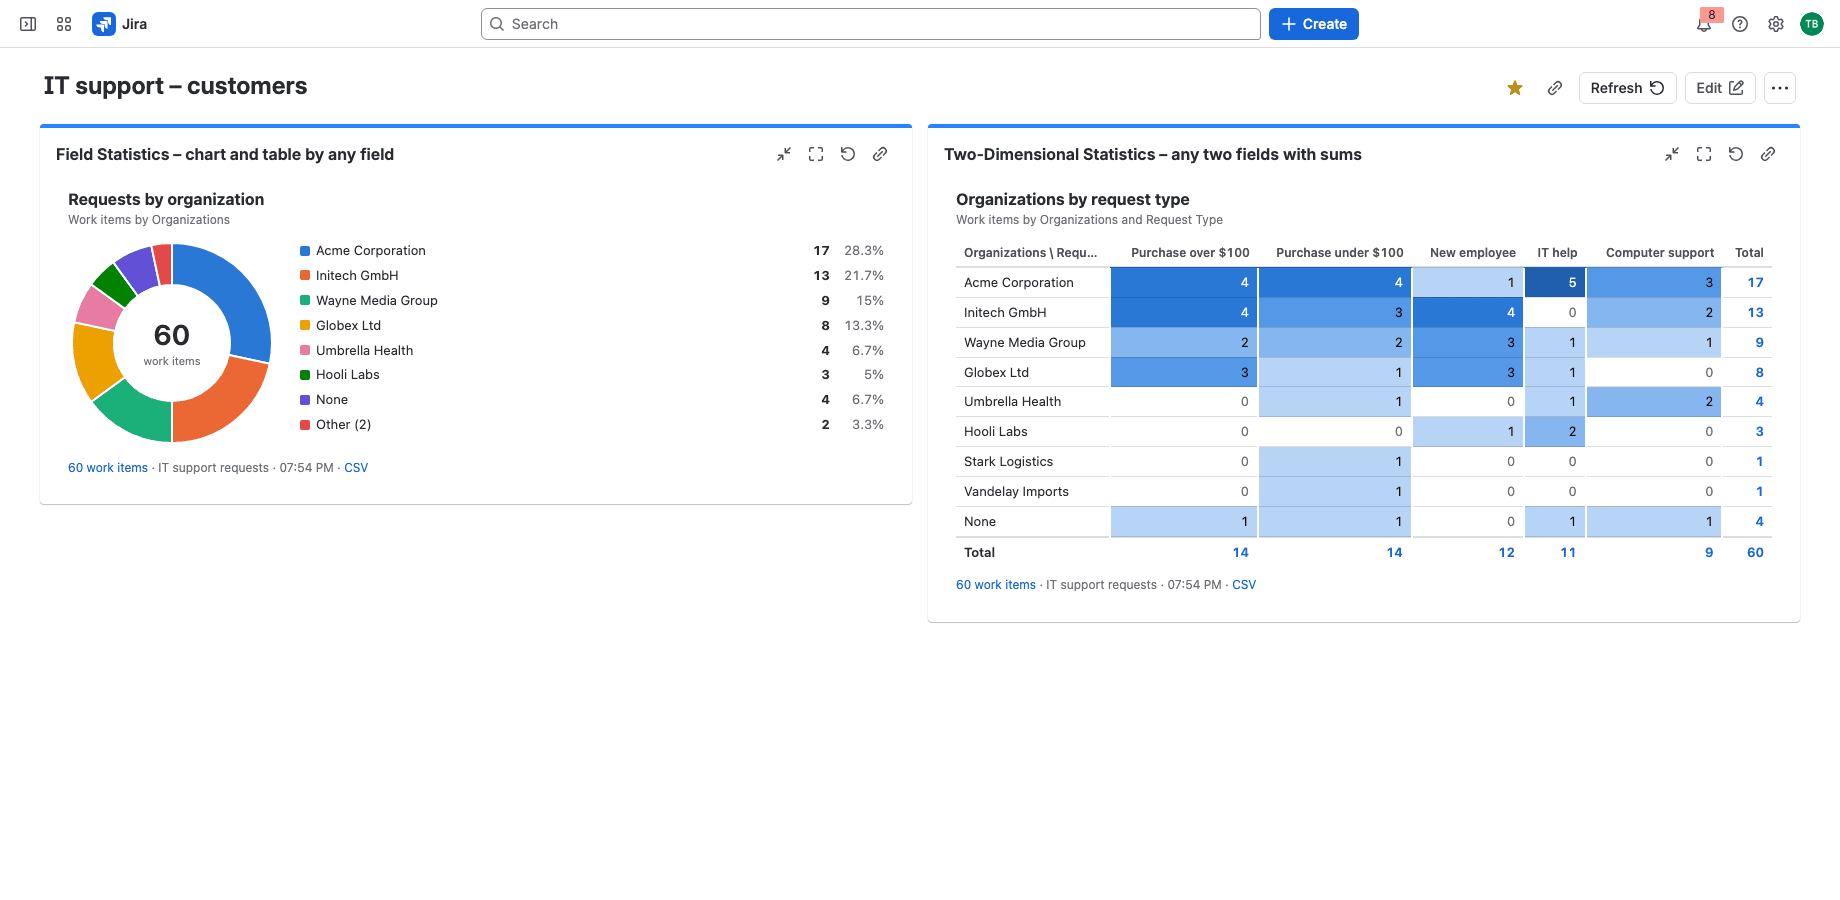
Organizations and request types
Report Jira Service Management by customer: Organizations and Request Type work as rows or columns. Click any number, bar or slice to open exactly those work items in the search.
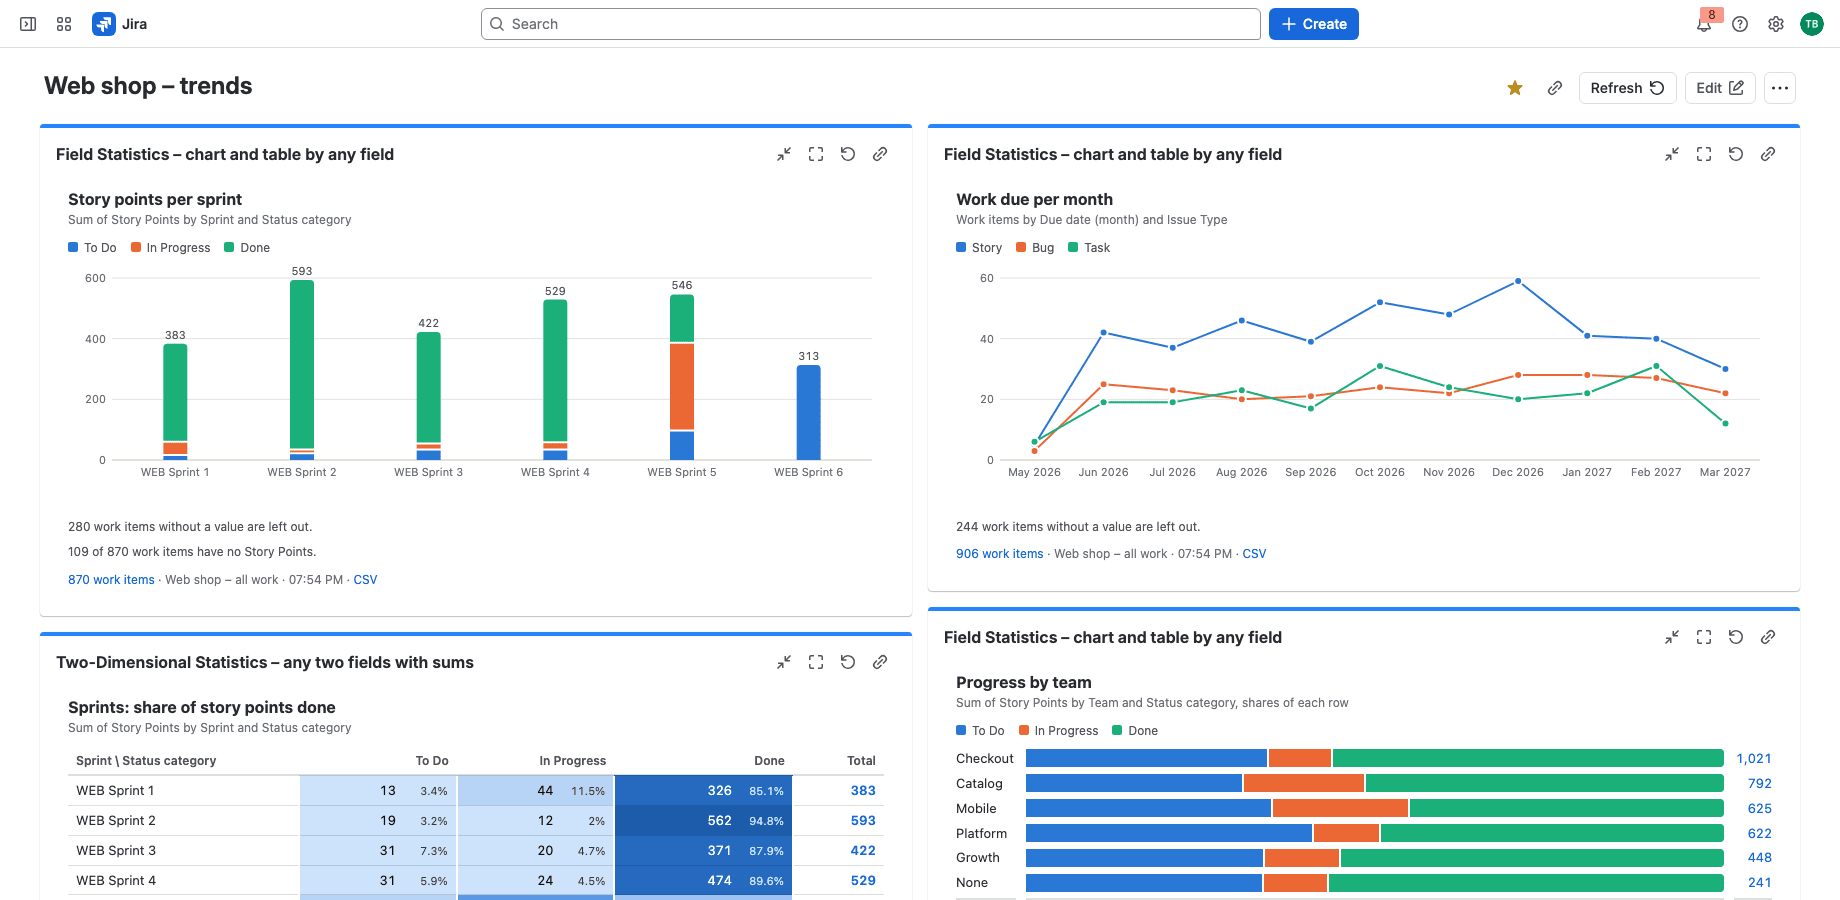
Charts and trends, no data stored
Bars, columns, 100 % stacks, pies and lines over days to years, running totals and shares of rows, with a live preview. Everything is read in your browser with your permissions; nothing is stored.
Runs on Atlassian
Built on Forge, hosted by Atlassian
- Platform
- Atlassian Forge, hosted by Atlassian
- Your data
- No data leaves Atlassian
- Availability
- In Atlassian’s review, not yet on the Marketplace
- Privacy, terms and security
- Documentation
Portfolio
More apps for Jira and Confluence
 JIRAUndeleteRecycle Bin & Restore for JiraOn Marketplace
 JIRAForm SyncCopy, Version History & Backup for Jira FormsOn Marketplace
 CONFUndeleteTrash Audit & Restore for ConfluenceOn Marketplace
 JIRACreate LinksPrefilled Create Issue Links for JiraIn review
 JIRATeam EstimationSizing Board & Planning Poker for JiraIn review
 JSMAsset LabelsBulk QR Labels for Jira AssetsIn review
 JSMCustomer Profiles & Healthfor Jira Service ManagementIn review
 CONFBlog to PageConvert & Archive Blog Posts for ConfluenceIn review
 CONFCQL ResultsSearch Tables for ConfluenceIn review
Support
Questions about Dashboard Statistics?
Documentation
Setup, features, privacy, terms and security.
Read the documentationSupport portal
Open a request and follow its progress.
Open the portalSupport e-mail
Write to support; your message becomes a request.
support@tsutsei-support.atlassian.net